Customising palettes in R
There are already a lot of great resources on how to choose pre-existing colour palettes in ggplot. I really like this one and here has a list of literally all the palettes available in ggplot organised by package (include a Studio Ghibli one in the works).
Here I’ll illustrate some ways of using pre-existing pastel palettes, and some tools to customise your own, using R’s pre-existing data.
Pre-existing pastel palettes
If we make a basic box plot in R using the iris data, we end up with a plot like this:
library(ggplot2)
ggplot(iris,aes(x=Species,y=Petal.Length))+
  geom_boxplot()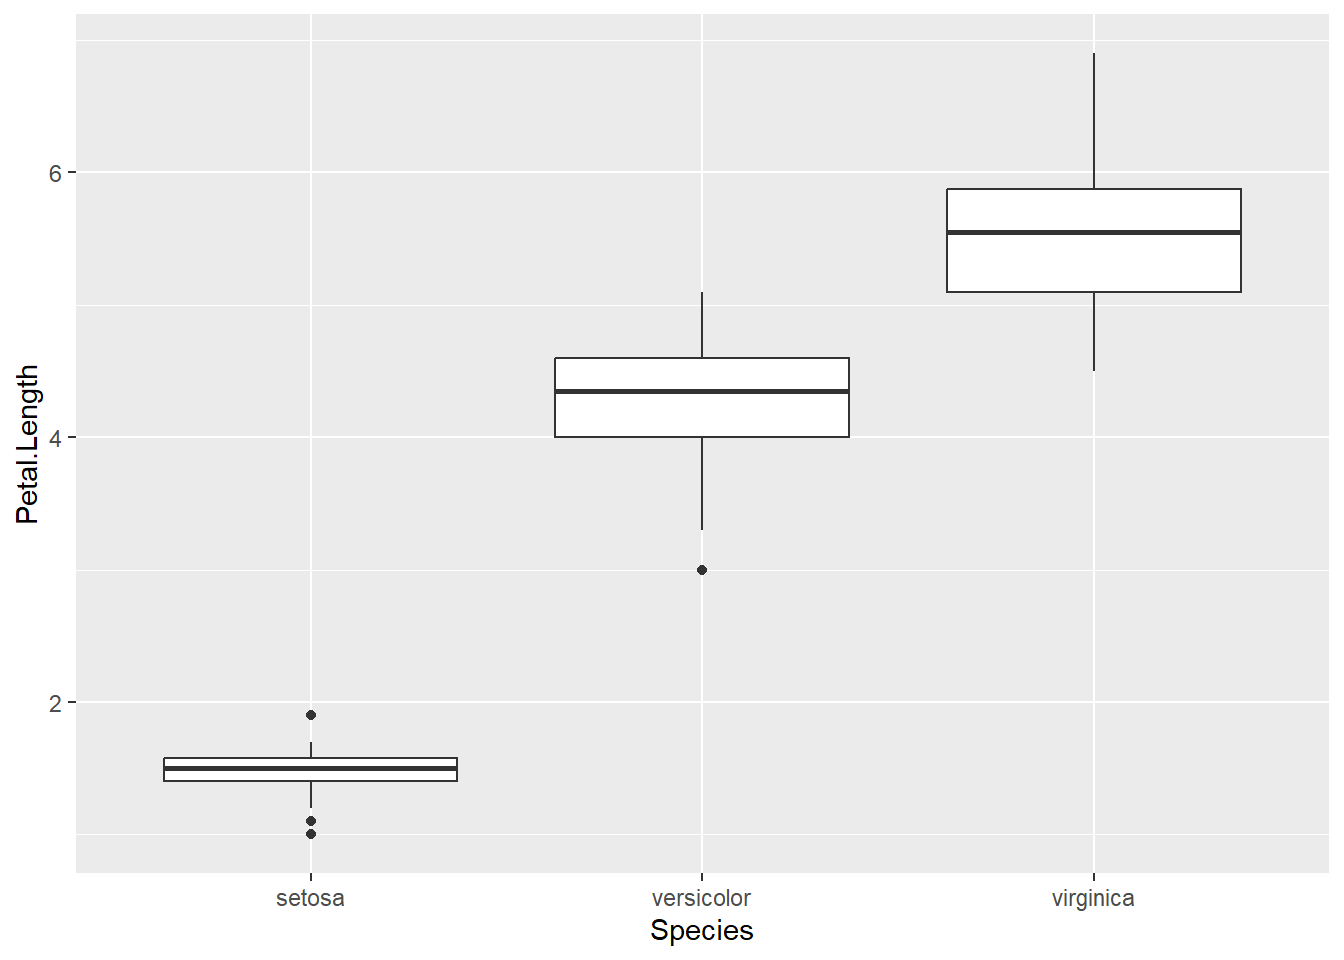
We might want to distinguish between the the three species a bit more easily, so we can add in colour using fill.
ggplot(iris,aes(x=Species,y=Petal.Length,fill=Species))+
geom_boxplot()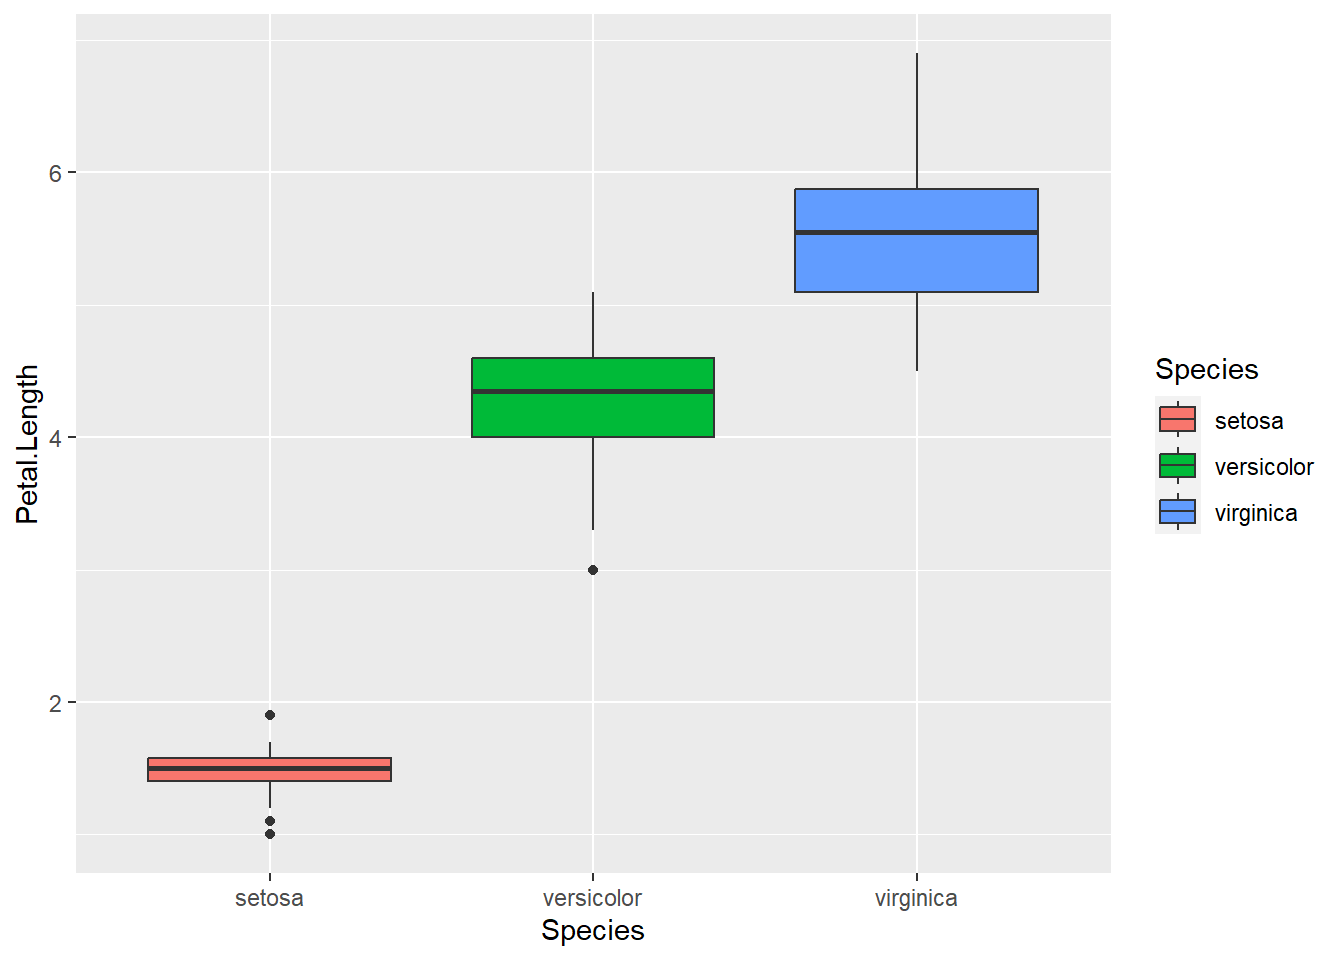 This is the default colour scheme that R uses, and it’s fine but it’s not pretty. So, we can use one of the pastel palettes from Color Brewer, which you can install using
 install.packages("RColorBrewer").
ggplot(iris,aes(x=Species,y=Petal.Length,fill=Species))+
geom_boxplot()+
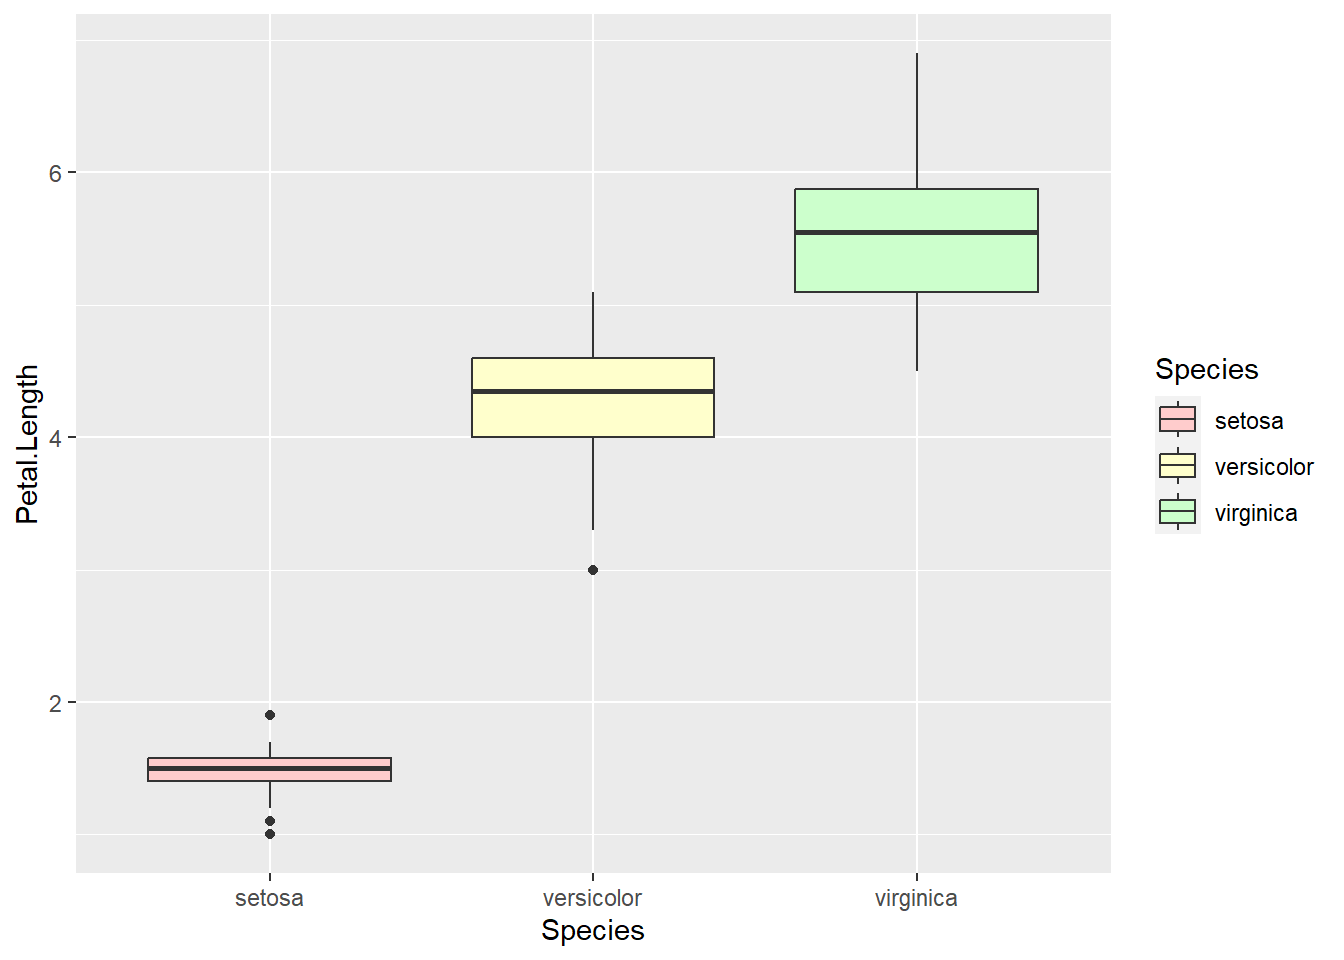
scale_fill_brewer(palette="Pastel2")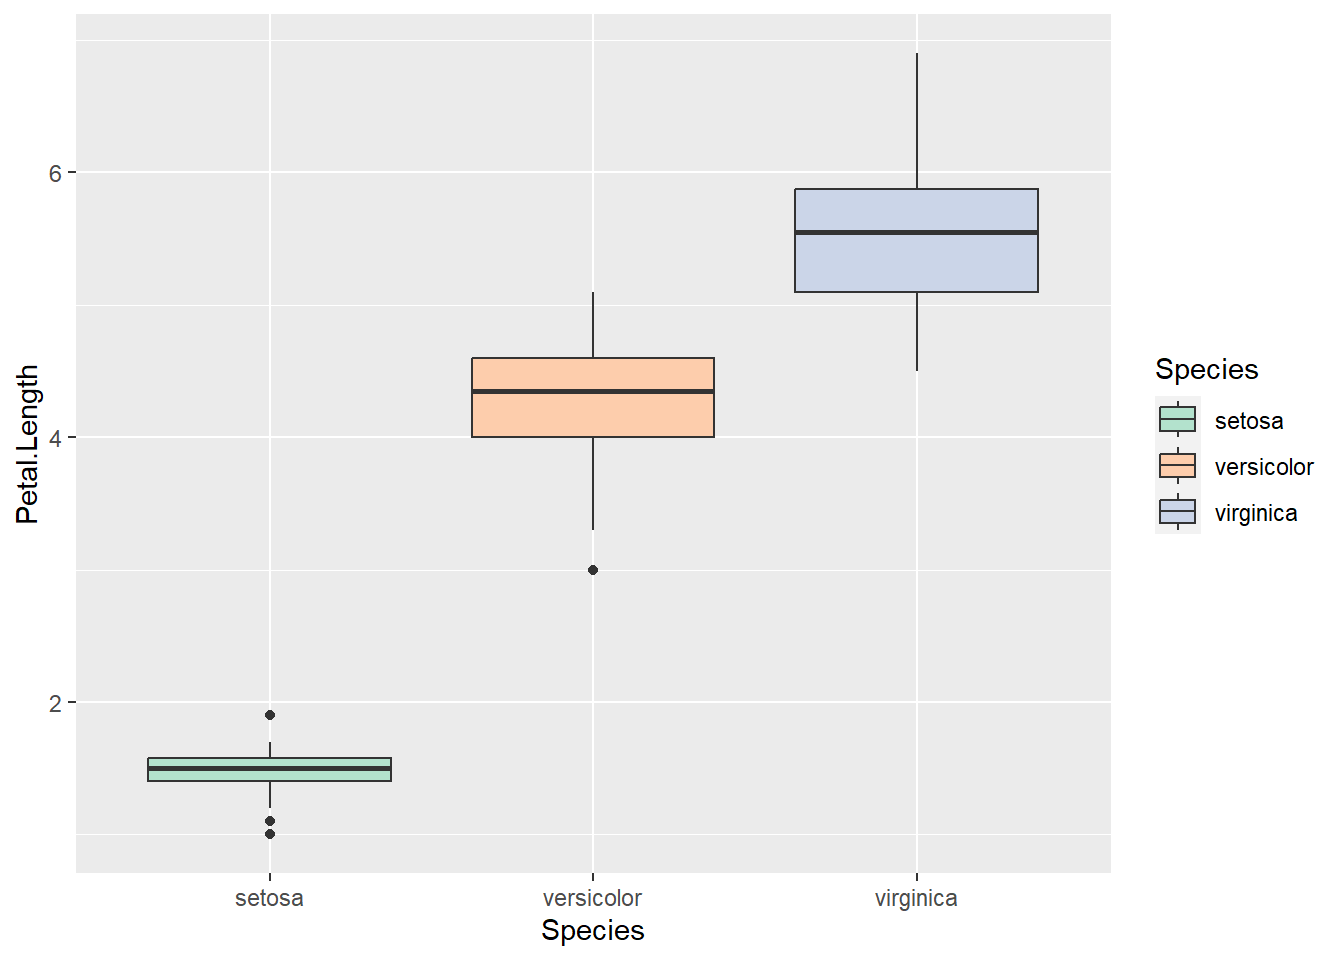 Much nicer! We could also use the first pastel option ‘Pastel1’ which has the same default colours, but in less aggressive shades.
ggplot(iris,aes(x=Species,y=Petal.Length,fill=Species))+
  geom_boxplot()+
  scale_fill_brewer(palette="Pastel1")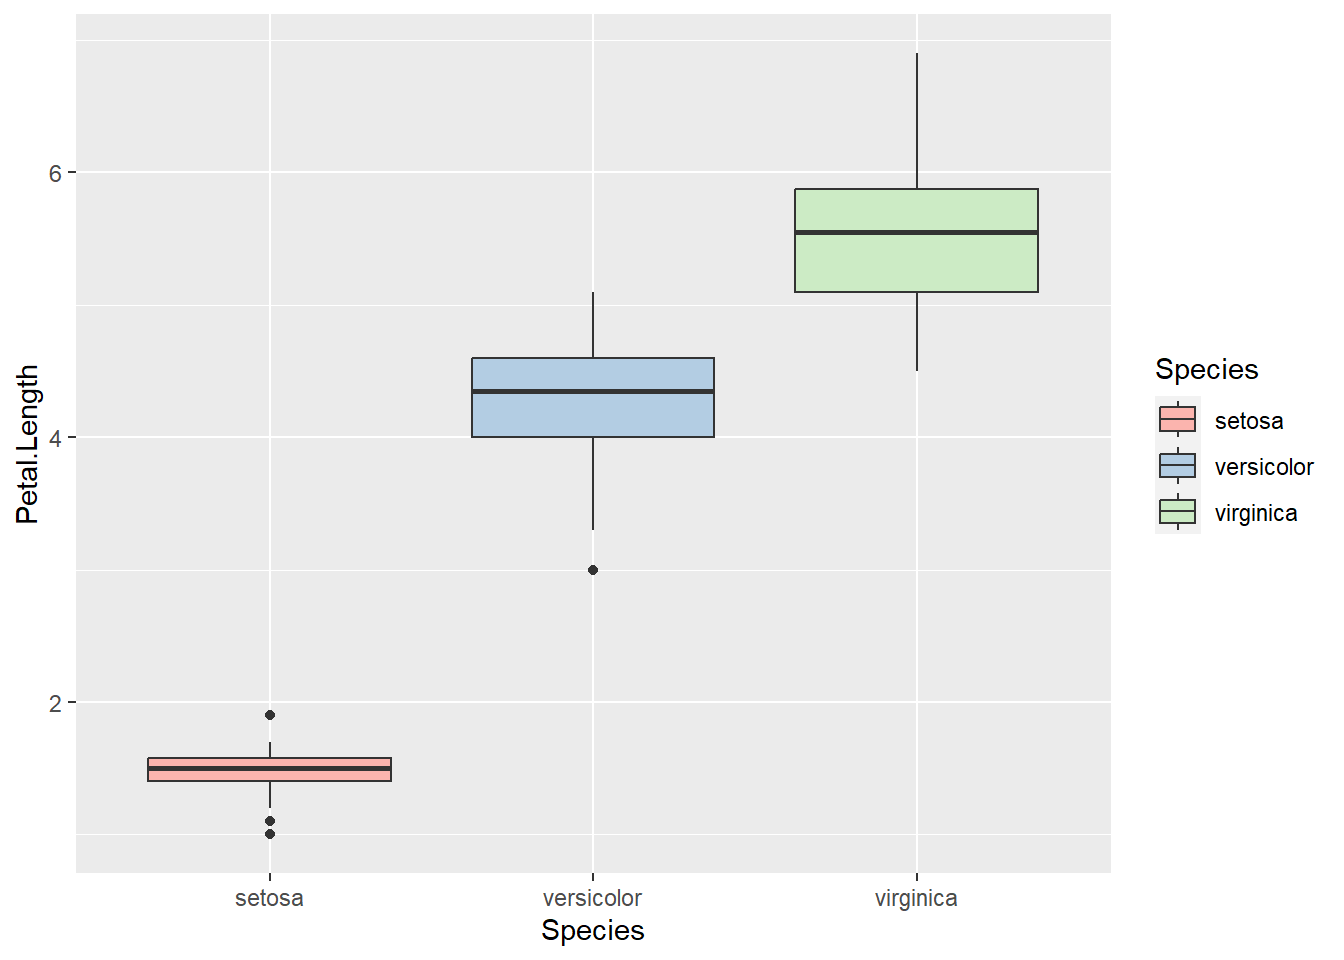
If you want to use these colours in a scatterplot rather than a box plot, you need to use the function scale_color_brewer(palette="") and color rather than fill:
ggplot(iris,aes(x=Petal.Length,y=Petal.Length,color=Species))+
  geom_point()+
  scale_color_brewer(palette="Pastel2")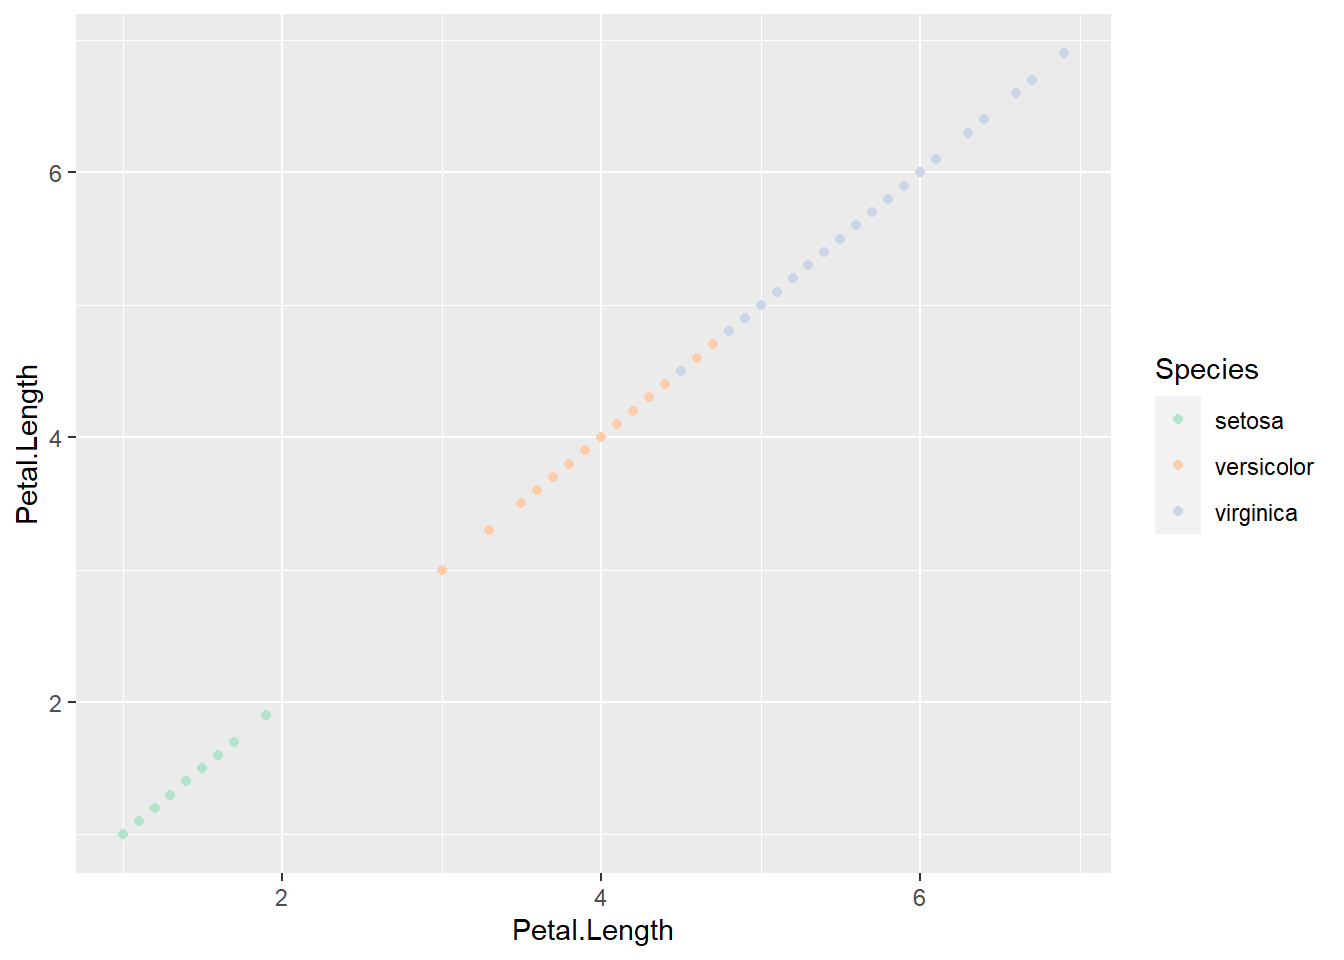
Manual Palette
I selected three pastel colours using this tool and entered them into the plot using scale_fill_manual(). Remember to include the #
ggplot(iris,aes(x=Species,y=Petal.Length,fill=Species))+
  geom_boxplot()+
  scale_fill_manual(values=c("#CCE5FF","#E5CCFF","#FFCCE5"))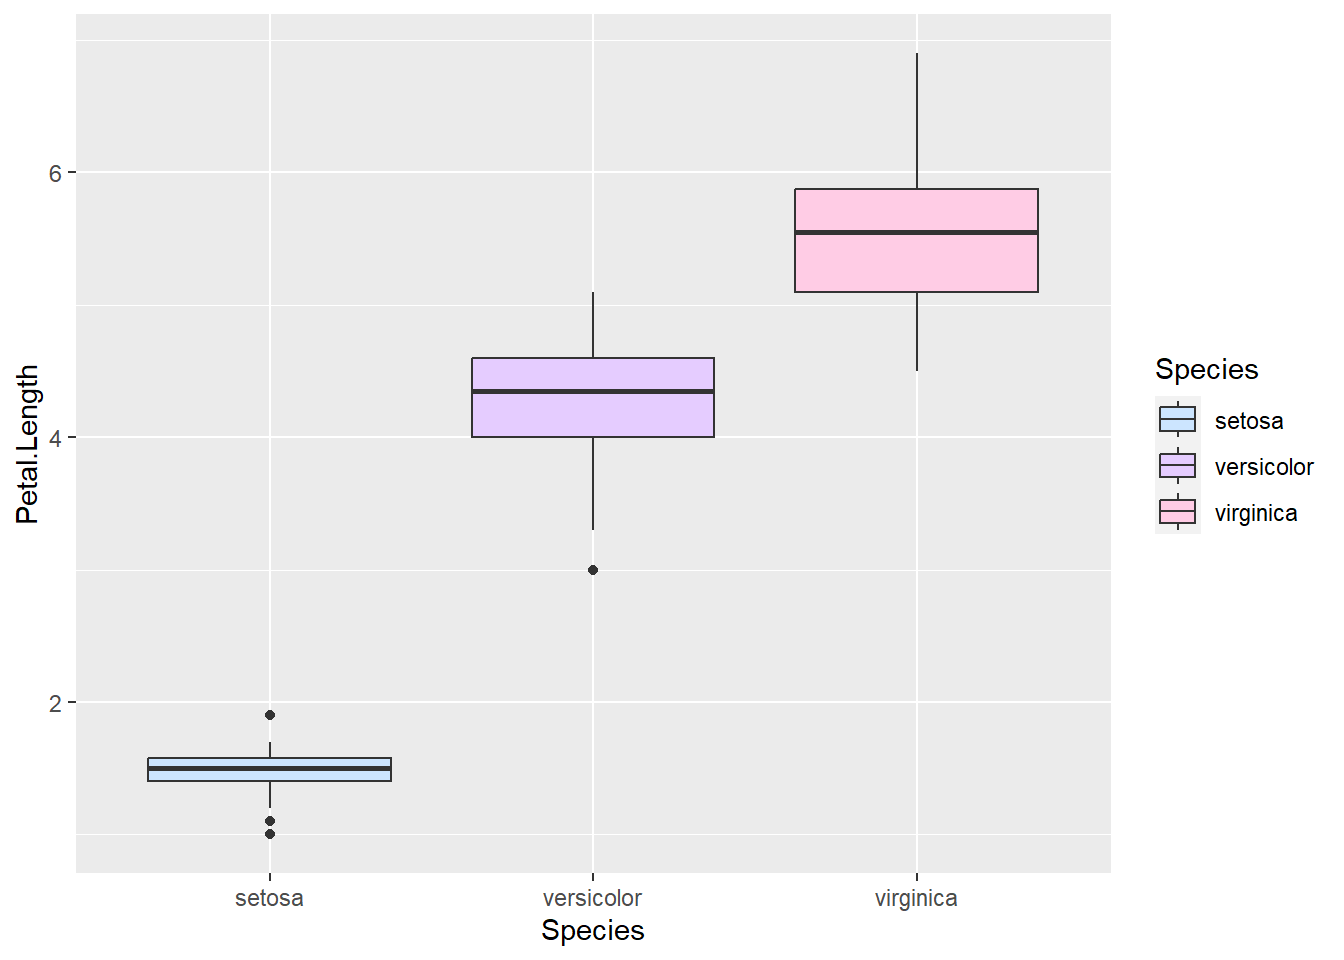
ggplot(iris,aes(x=Petal.Length,y=Petal.Length,color=Species))+
geom_point()+
scale_color_manual(values=c("#FFF0F5","#E6E6FA","#F0FFFF"))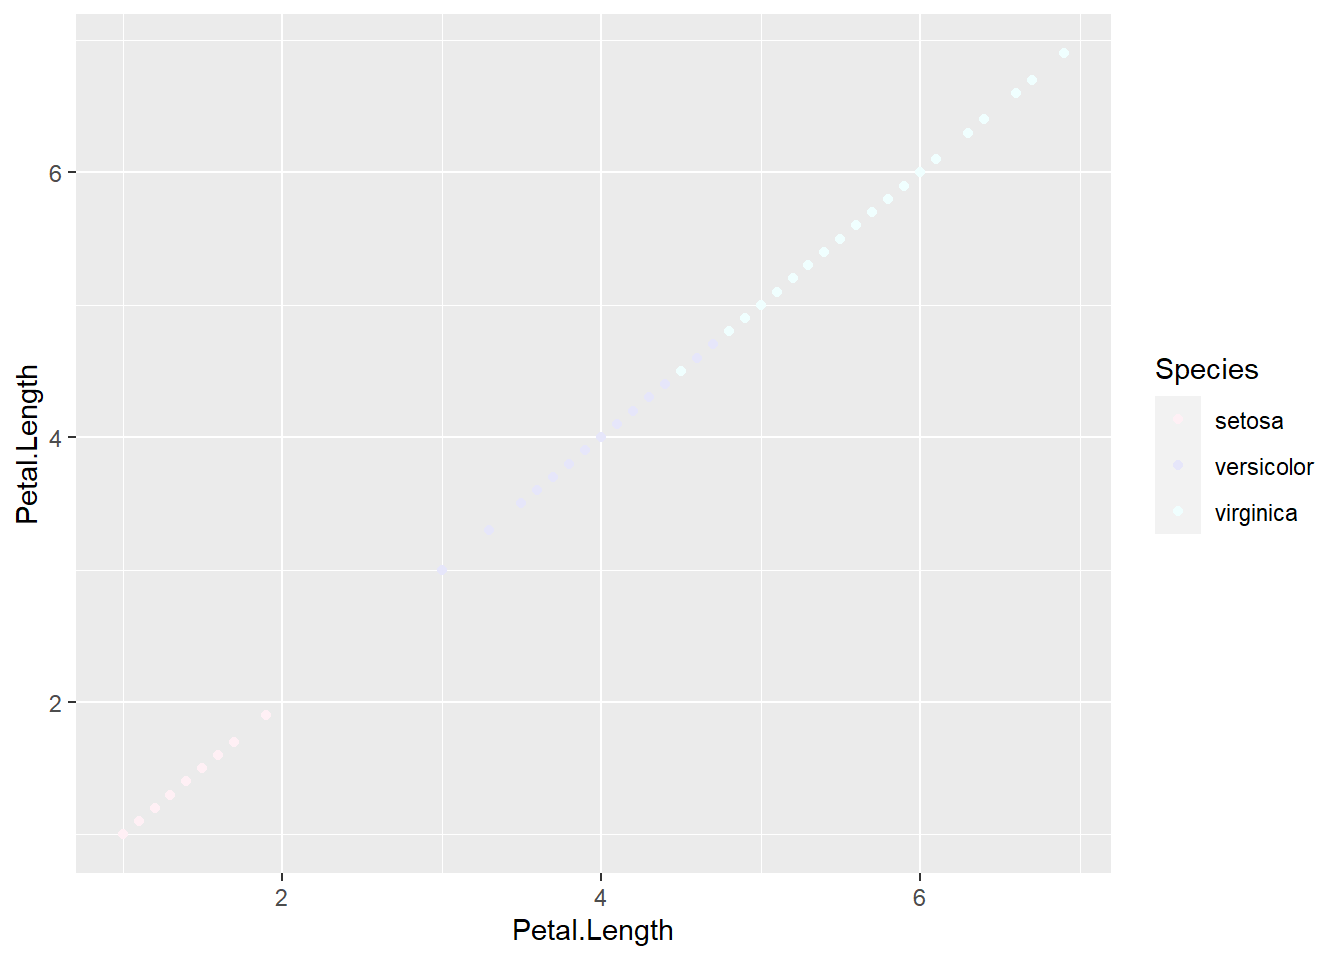 As you can tell from the last two plots, different colours work better than others in different plots, and it’s up to you to figure out the best choice for your purposes.
You can also save multiple colours into a palette, and then use that palette in the plot.
pastel_me <- c("#FFCCCC","#FFFFCC","#CCFFCC")
ggplot(iris,aes(x=Species,y=Petal.Length,fill=Species))+
  geom_boxplot()+
  scale_fill_manual(values=pastel_me)